Amazon Web Services · QuickSight
LayerMap
A QuickSight map visual that joins customer data to custom GeoJSON polygons.
I built LayerMap using MapLibre, React, and TypeScript. It took in a GeoJSON file, parsed its features, and joined properties from those features with fields in the customer’s dataset before displaying the resulting shapes on the map.
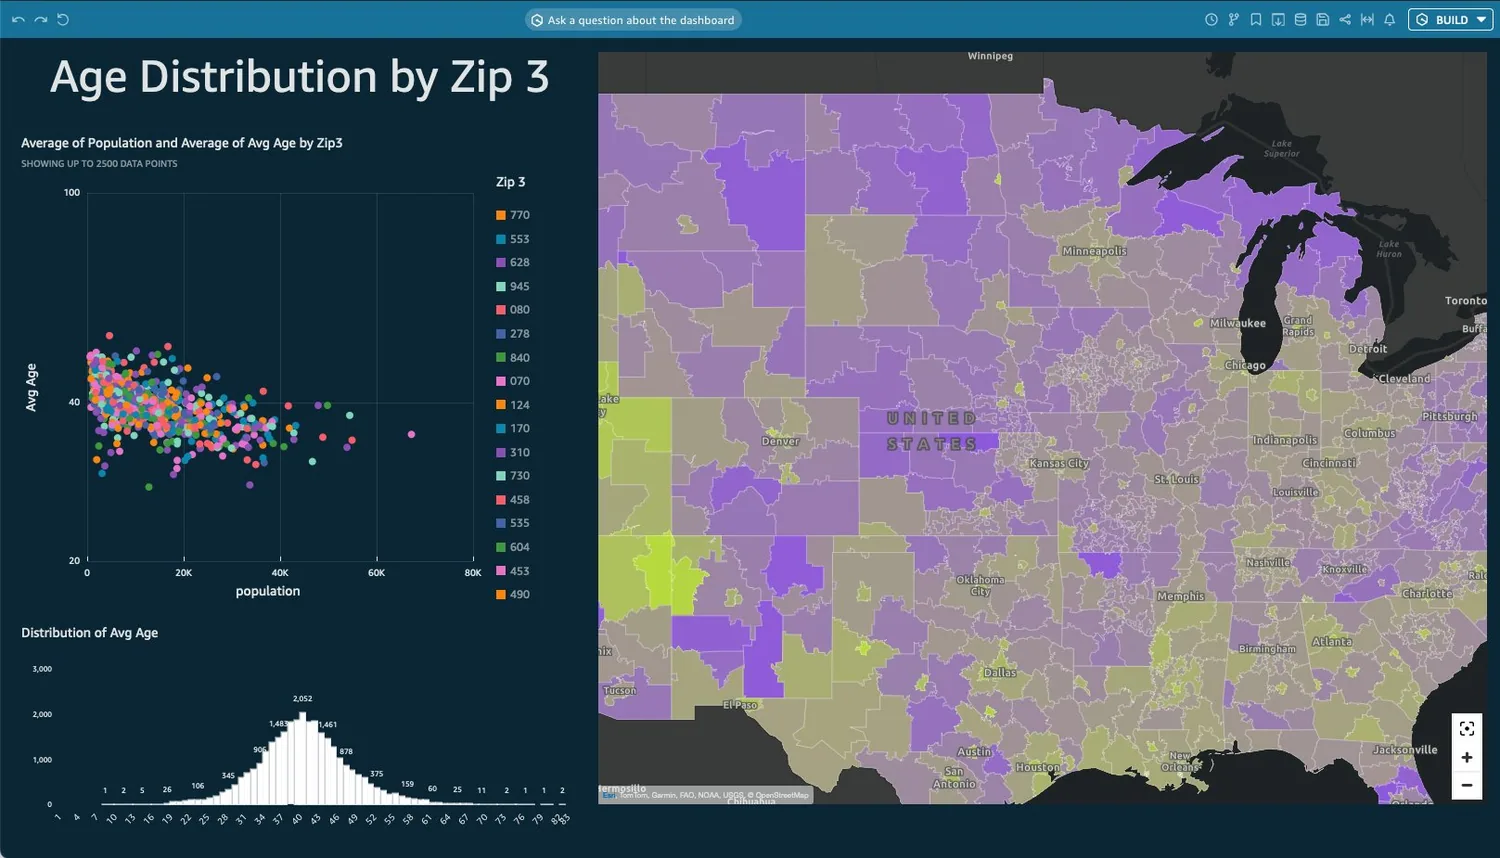
Image from AWS announcement post.
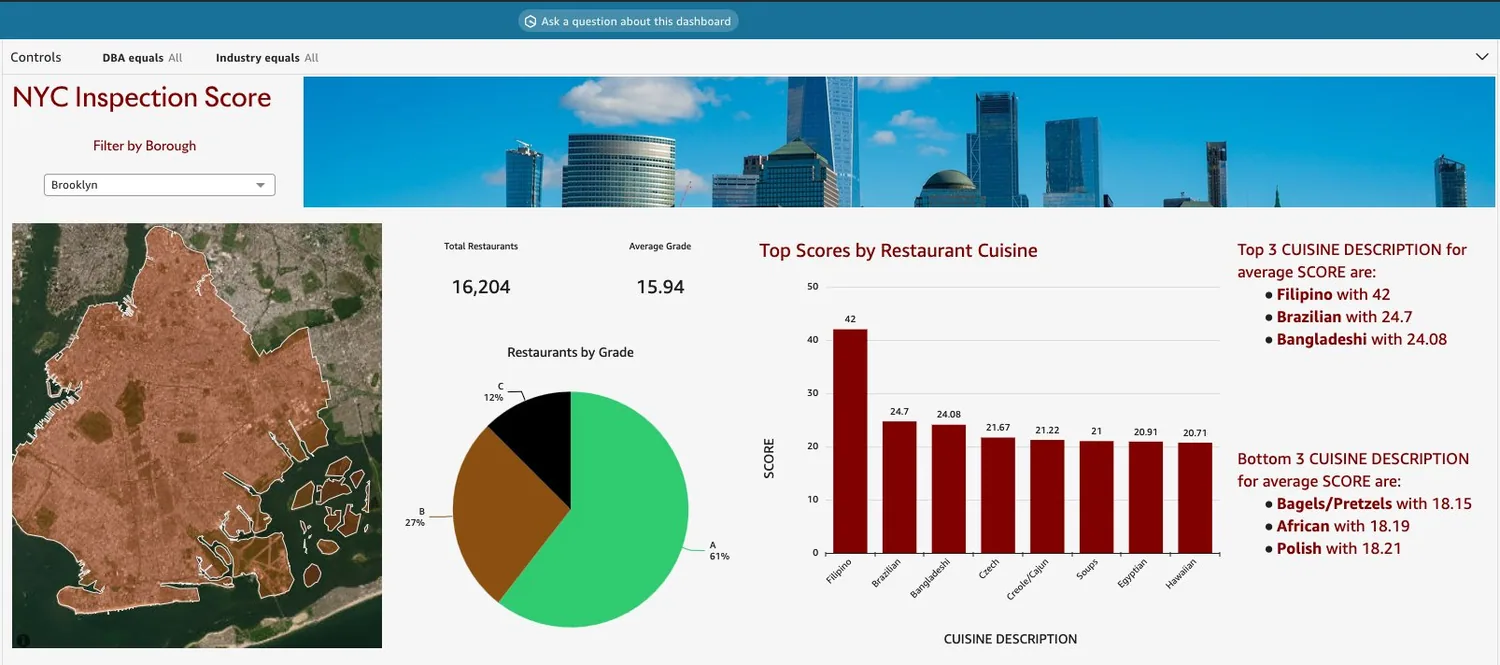
Image from AWS announcement post.
For example, a GeoJSON file could define the boundaries of the five New York City boroughs. If the customer dataset also contained a borough field, LayerMap could join each row to the matching feature and use the customer’s values to color and style those shapes.
This was useful because these shapes are not conventionally geocoded. They are custom boundaries, such as boroughs, sales territories, or service areas, that do not necessarily map to the built-in geographic hierarchy. LayerMap let customers bring those shapes into QuickSight and connect them directly to their own data.