Amazon Web Services · QuickSight
Sheet Tooltip
A QuickSight tooltip that renders a small sheet of related visuals when someone hovers a data point.
QuickSight tooltips normally show a value or label. A sheet tooltip can contain multiple visuals, so hovering over one data point can bring up a small, focused dashboard with the related context.
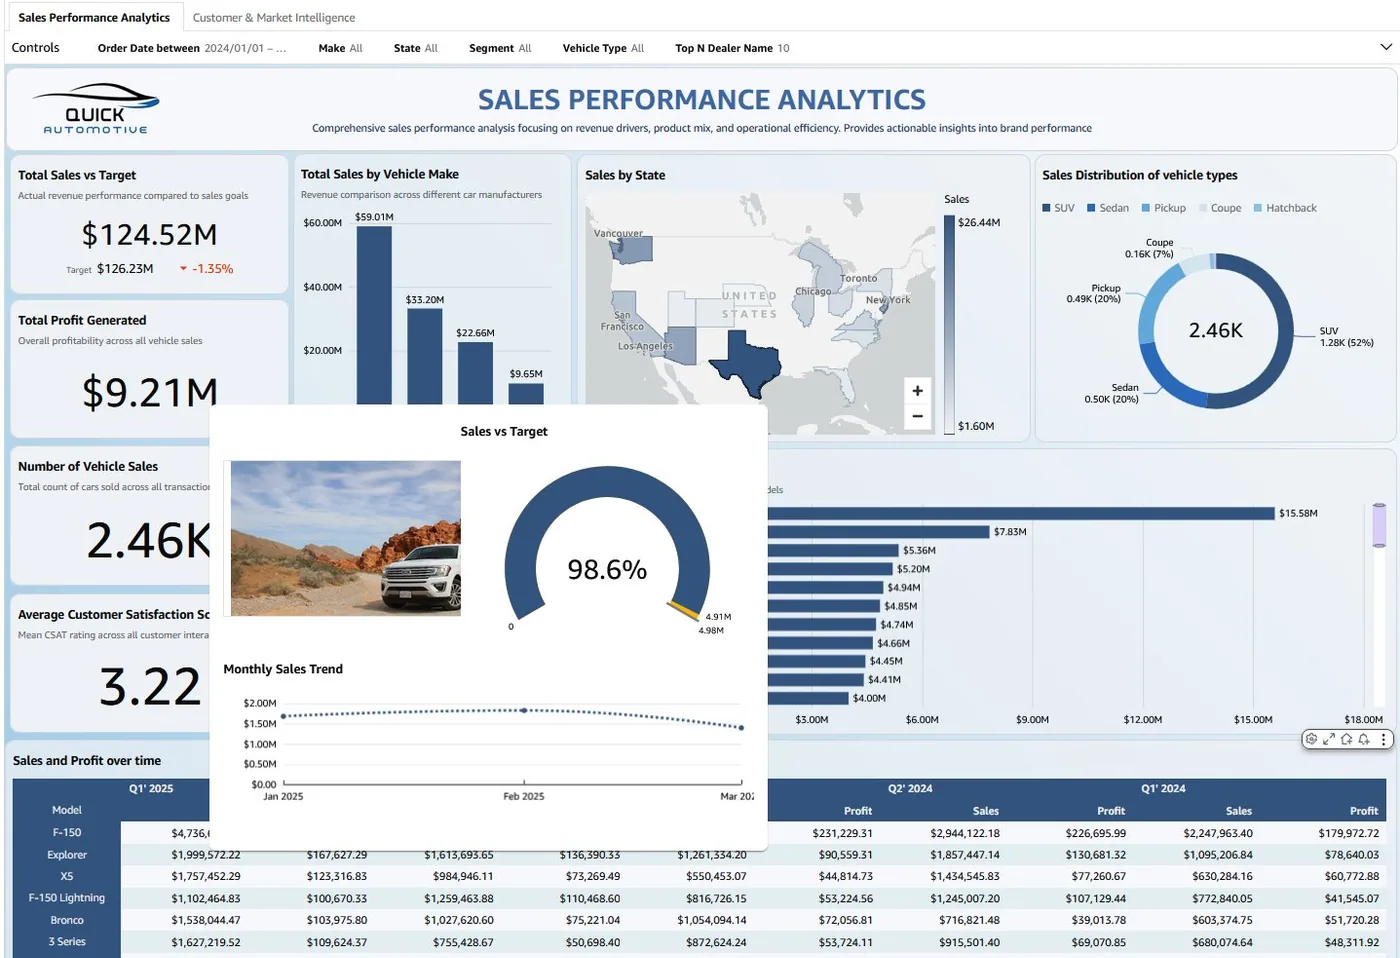
Image from AWS announcement post.
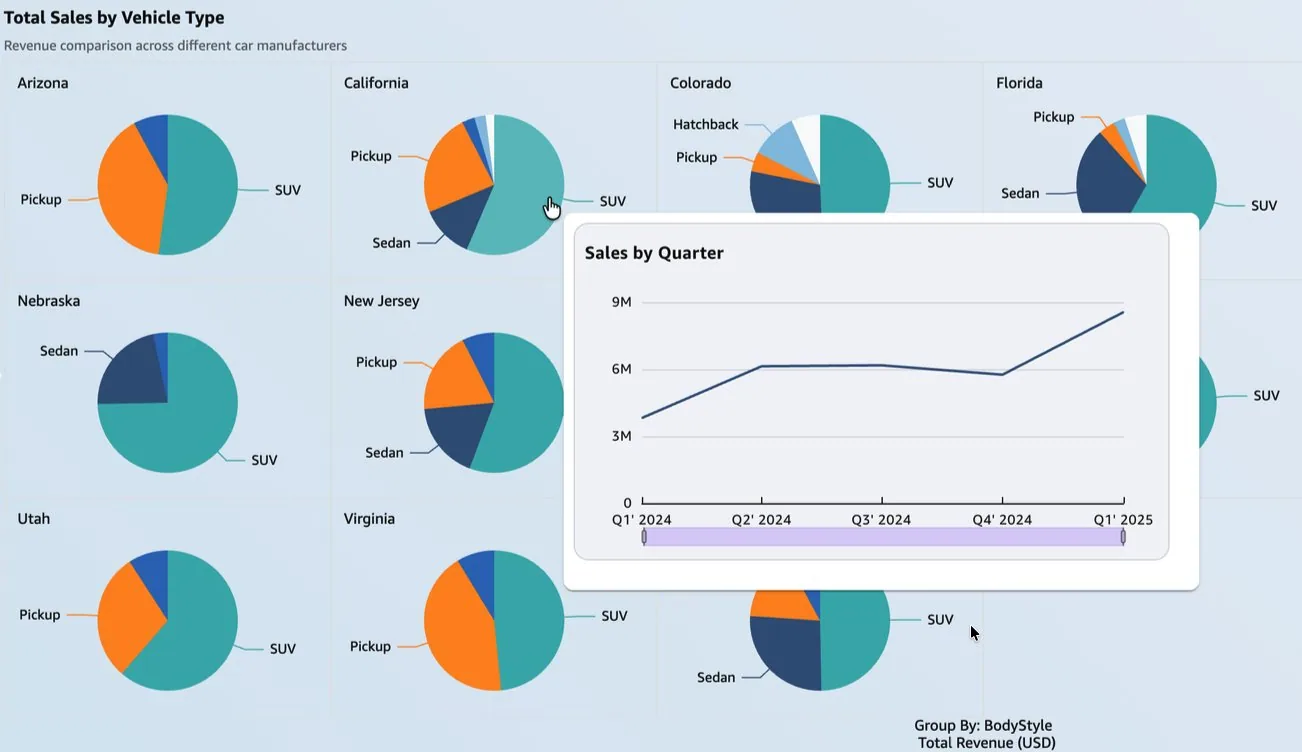
Image from AWS announcement post.
One of the most fun parts was building the smart positioning algorithm. Given the cursor position, tooltip size, and available space around the visual, it chose where to open the tooltip so it stayed out of the reader’s way while making the best use of the screen.
Among many other things, I also worked on layout in the authoring experience. When an author added a new visual to a tooltip sheet, we needed to find a useful starting position without covering the visuals that were already there. It sounds like a small interaction, but it made building these multi-visual tooltips feel much more natural.
Probably the most technically complex part was cache eviction. QuickSight stores rendered charts in a front-end cache, and tooltip sheets increased the number of charts a dashboard could have loaded at once. I implemented an LRU eviction strategy with a victim cache that acted as a second-chance buffer for recently evicted charts.
That second layer was important when navigating between sheets. Without it, returning to a sheet could reload charts that had just been removed, while the newly loaded charts displaced something the reader was about to revisit. The victim cache gave those charts another chance to be restored before doing the full work again, which reduced cache thrashing as readers moved around a dashboard.
I was particularly proud of this when I saw sheet tooltips being used on the NFL Combine and NBA Draft pages :)